Donnant suite à notre article sur l’écosystème Prometheus, et celui sur le déploiement de Kubernetes sur Raspberry Pi, nous documenterons aujourd’hui le déploiement de Prometheus dans Kubernetes, afin de superviser notre cluster.
Prometheus est particulièrement adapté au contexte de clusters OpenShift ou Kubernetes, celui-ci pouvant interroger l’API du cluster à la recherche de services à superviser.
Plusieurs modes de déploiement existent, divers opérateurs, à commencer par le Prometheus Operator, voire des charts Helm, ou s’appuyant sur Kustomize, …
Pour ne dépendre d’aucun framework, et corriger l’absence de support ARM pour une image, nous préférerons déployer les différentes composantes de Prometheus nous même. Ce choix restant arbitraire, les solutions évoquées ci-dessus restent pertinentes.
Déploiement de Prometheus
Vous trouverez les fichiers YAML servant au déploiement sur GitHub.
Dans un premier temps, déployer le serveur Prometheus :
$ git clone https://github.com/Worteks/k8s-prometheus
$ cd prometheus-k8s
$ kubectl create ns prometheus-monitoring
$ kubect apply -n prometheus-monitoring -f prometheus-serviceaccount.yaml
$ kubect apply -f prometheus-clusterrole.yaml
$ sed "s|NAMESPACE_SED|prometheus-monitoring|" prometheus-clusterrolebinding.yaml \
    | kubectl apply -f-
$ sed "s|NAMESPACE_SED|prometheus-monitoring|" prometheus-configmap.yaml \
    | kubectl apply -n prometheus-monitoring -f-
$ find prometheus-rules.d/ -type f -name '*.yaml' | cut -d/ -f2 | while read file
    do
        cmname=`echo "$file" | sed 's|\.yaml$||'`
        kubectl create cm prometheus-rule-$cmname --dry-run=client -o yaml \
            --from-file=$file=./prometheus-rules.d/$file \
            | kubectl apply -n prometheus-monitoring -f-
    done
$ kubectl apply -n prometheus-monitoring -f prometheus-statefulset.yaml
$ kubectl apply -n prometheus-monitoring -f prometheus-service.yaml
$ sed "s|ROOT_DOMAIN|demo.local|" prometheus-ingress.yaml \
    | kubectl apply -n prometheus-monitoring -f-
$ kubectl get pods -n prometheus-monitoring -w
Ici, nous avons créé un Namespace prometheus-monitoring. Dans ce Namespace, nous créons un ServiceAccount. Nous déclarons ensuite un ClusterRole, permettant d’interroger l’API du cluster à la recherche de noeuds, services, endpoints, … nécessaires à l’intégration de Prometheus dans Kubernetes. Le ClusterRoleBinding délègue les privilèges définis dans notre ClusterRole, au ServiceAccount créé précédemment. Nous déclarons ensuite une ConfigMap, encapsulant la configuration de notre serveur Prometheus. Celle-ci interrogera l’API du cluster Kubernetes, à la recherche de métriques relatives aux noeuds, ou de Services Kubernetes, fonctions de leurs labels. Nous importons alors une suite de règles, dans de nouvelles ConfigMap, définissant les seuils d’alerte, pour chacun des service que Prometheus pourrait superviser. Enfin, nous créons un StatefulSet et un Service. Un conteneur Prometheus se lance.
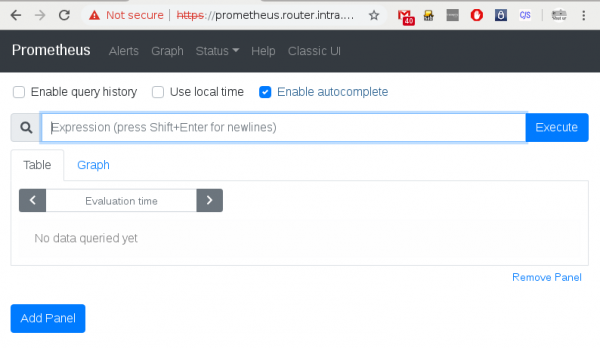
Une fois que celui-ci a démarré, nous pourrons nous connecter à l’interface Prometheus :
Métrologie Kubernetes
Pour superviser un cluster Kubernetes, il faudra ensuite déployer kube-state-metrics, un exporteur agrégeant des métriques produites par l’interrogation de l’API du cluster Kubernetes, et décrivant sa composition :
$ kubectl apply -n prometheus-monitoring -f kube-state-metrics-serviceaccount.yaml
$ kubectl apply -f kube-state-metrics-clusterrole.yaml
$ sed "s|NAMESPACE_SED|prometheus-monitoring|" kube-state-metrics-clusterrolebinding.yaml \
    | kubectl apply -f-
$ kubectl apply -n prometheus-monitoring -f kube-state-metrics-deployment.yaml
$ kubectl apply -n prometheus-monitoring -f kube-state-metrics-service.yaml
$ kubectl get pods -n prometheus-monitoring -w
Nous pourrons de même déployer le DaemonSet node-exporter, exposant des métrique relatives aux noeuds, membres du cluster :
$ kubectl apply -n prometheus-monitoring -f node-exporter-serviceaccount.yaml
$ kubectl apply -f node-exporter-podsecuritypolicy.yaml
$ kubectl apply -f node-exporter-clusterrole.yaml
$ sed "s|NAMESPACE_SED|prometheus-monitoring|" node-exporter-clusterrolebinding.yaml \
    | kubectl apply -f-
$ kubectl apply -n prometheus-monitoring -f node-exporter-daemonset.yaml
$ kubectl apply -n prometheus-monitoring -f node-exporter-service.yaml
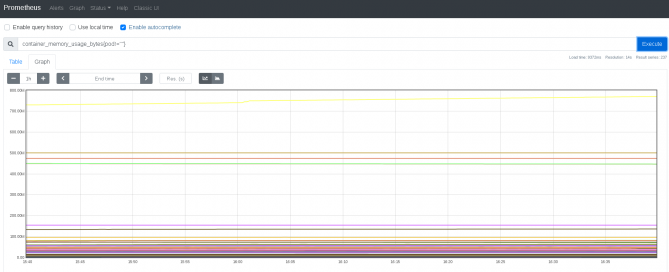
Une fois ces services déployés, de retour sur l’interface Prometheus, nous devrions retrouver leurs métriques :
Supervision
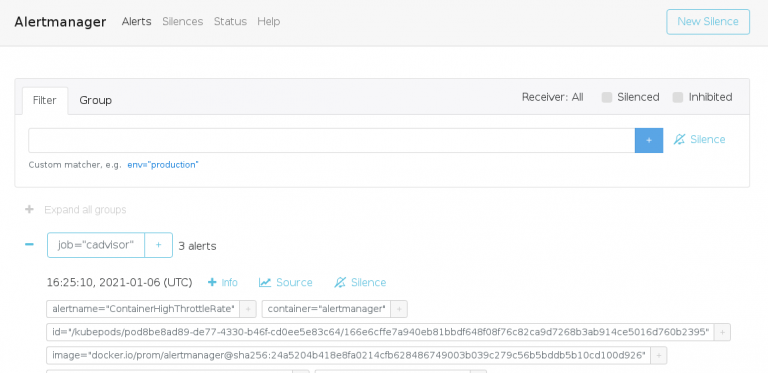
Si l’on veut que des alertes soient émises, fonction des règles que nous avons préalablement chargées en déployant Prometheus, alors nous devrons déployer l’AlertManager. Pour renvoyer vos alertes vers Slack, utiliser :
$ sed "s|SLACK_URL_SED|https://hooks.slack.com/services/XXX/YYY/ZZZZZZZ|" \
    alertmanager-secret-slack.yaml | echo kubectl apply -n prometheus-monitoring -f-
$ kubectl apply -n prometheus-monitoring -f alertmanager-statefulset.yaml
$ kubectl apply -n prometheus-monitoring -f alertmanager-service.yaml
$ sed "s|ROOT_DOMAIN|demo.local|" alertmanager-ingress.yaml \
    | kubectl apply -n prometheus-monitoring -f-
$ kubectl apply -n prometheus-monitoring -f alertmanager-exporter-service.yaml
Si l’on avait voulu renvoyer ces notifications vers un relais SMTP, nous aurions pu utiliser :
$ sed -e "s|MAILFROM_SED|alertmanager@demo.local|" \
    -e "s|MAILRELAY_SED|smtp.demo.local|" \
    -e "s|MAILTO_SED|alerts-monitoring@demo.local|" \
    alertmanager-secret-mails.yaml \
    | kubectl apply -n prometheus-monitoring -f-
$ kubectl apply -n prometheus-monitoring -f alertmanager-statefulset.yaml
$ kubectl apply -n prometheus-monitoring -f alertmanager-service.yaml
$ kubectl apply -n prometheus-monitoring -f alertmanager-exporter-service.yaml
$ sed "s|ROOT_DOMAIN|demo.local|" alertmanager-ingress.yaml \
    | kubectl apply -n prometheus-monitoring -f-
$ kubectl get pods -n prometheus-monitoring -w
Quand ce conteneur aura démarré, nous pourrons nous y connecter :
Dashboards
Enfin, nous pourrons rajouter un déploiement de Grafana, pour y visualiser les métriques Prometheus :
$ find grafana-dashboards.d/ -type f -name '*.json' | cut -d/ -f2 | while read file; \
    do
        cmname=`echo "$file" | tr [A-Z] [a-z] | sed -e 's|[_-]*||' -e 's|\.json\$||'`
        kubectl create cm grafana-dashboard-$cmname \
            --dry-run=client -o yaml \
            --from-file=$$file=./grafana-dashboards.d/$$file \
            | kubectl apply -n prometheus-monitoring -f-; \
    done
$ sed -e "s|GRAFANA_ADMIN_PASSWORD|secret|" \
    -e "s|ROOT_DOMAIN|demo.local|" \
    grafana-secret.yaml \
    | kubectl apply -n prometheus-monitoring -f-
$ sed "s|NAMESPACE_SED|prometheus-monitoring|" grafana-prometheus-configmap.yaml \
    | kubectl apply -n prometheus-monitoring -f-
$ kubectl apply -n prometheus-monitoring -f grafana-deployment.yaml
$ kubectl apply -n prometheus-monitoring -f grafana-service.yaml
$ sed "s|ROOT_DOMAIN|demo.local|" grafana-ingress.yaml \
    | kubectl apply -n prometheus-monitoring -f-
$ kubectl get pods -n prometheus-monitoring -w
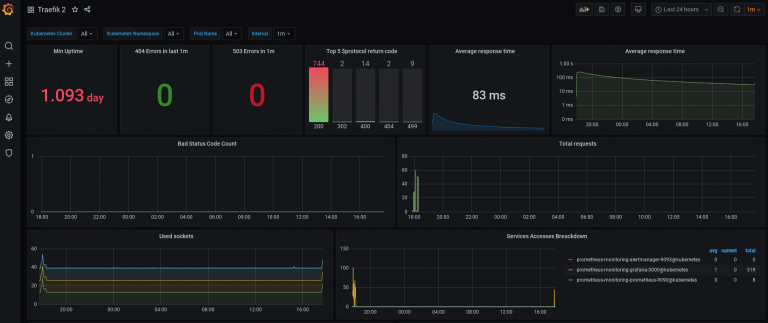
À nouveau, attendre que le Pod ne se lance pour se connecter à l’interface. Plusieurs dashboards sont déja présentes, chargées depuis le dossier grafana-dashboards.d, et majoritairement reprises des exemples disponibles sur grafana.com :
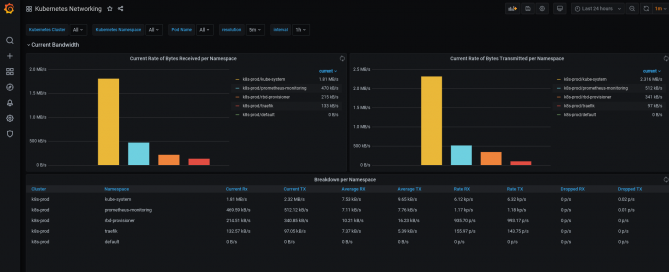
Suivant les applications déployées sur votre cluster, certaines dashboards trouveront leur utilité :
Conclusion
Déployer Prometheus pour superviser un cluster Kubernetes représente un gain non négligeable, en termes de simplicité et maintenabilité, par opposition aux solutions plus traditionnelles comme Icinga, Shinken, Centreon ou Zabbix, et plus fiable que certaines solutions cloud native comme Datadog.
Si l’écosystème Prometheus constitue une excellente solution de supervision, dans le contexte d’un cluster Kubernetes, il s’agit d’un incontournable.